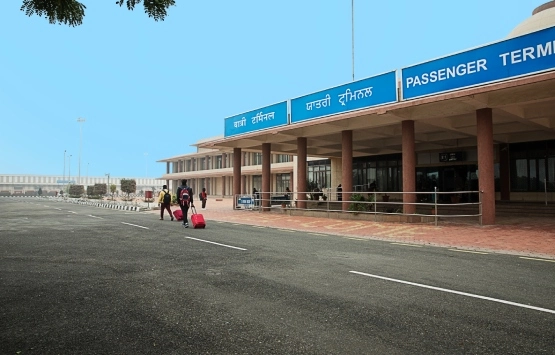
Attari Land Port at a Glance
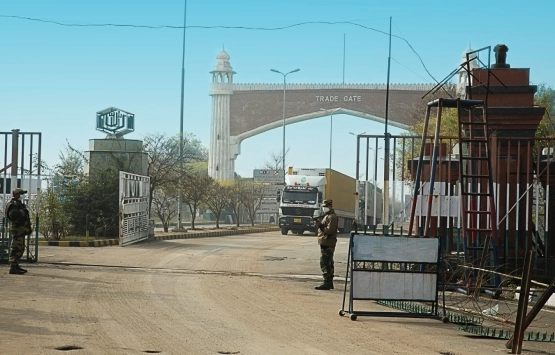
- India developed its first Land Port at Attari along the international border between India and Pakistan, located at a distance of about 28 kms from the city of Amritsar.
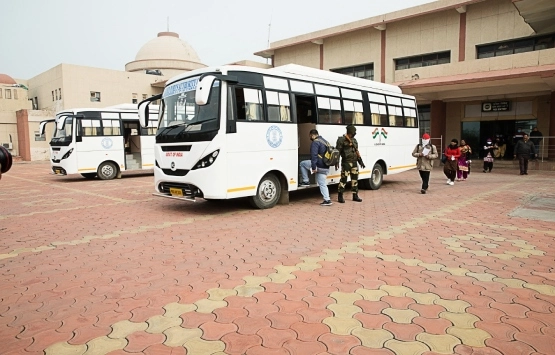
- Land Port Attari is positioned as an extremely important check-point as Attari-Wagah is the only permissible land route allowed for trade between India and Pakistan.
- The Land Port serves as an important port for importing goods from Afghanistan into India.
- Spread over a total area of 120 acres, Land Port Attari has a direct access with National Highway-I.
| Year | Total Trade (Crores) | Total Cargo Movement (Nos) | Total Passenger Movement (Nos) |
|---|---|---|---|
| 2017-18 | 4,148.15 | 48,193 | 80,314 |
| 2018-19 | 4,370.78 | 49,102 | 78,471 |
| 2019-20 | 2,772.04 | 6,655 | 78,675 |
| 2020-21 | 2,639.95 | 5,250 | 6,177 |
| 2021-22 | 3,002.38 | 4,812 | 10,342 |
| 2022-23 | 2,257.55 | 3,827 | 67,747 |
| 2023-24 | 3886.53 | 6,871 | 71,563 |
| 2024-25 | 4148.53 | 7,348 | 1,15,561 |
| 2025-26 | 117.02 | 214 | 29,943 |
-
 Stakeholders
 -
 Items Of Export
 -
 Items Of Import
- Land Ports Authority of India
- Customs
- Bureau of Immigration
- Border Security Force
- Plant Quarantine, Ministry of Agriculture & Farmers Welfare
- Human Quarantine, Ministry of Health and Family Welfare
Mechanized Cargo Handling Equipment:
- Pay loader
- Hydra crane
- Soyabean
- Chicken Feed
- Vegetables
- Red Chilies
- Plastic Dana
- Plastic Yarn
- Dry Fruits
- Dry Dates
- Gypsum
- Cement
- Glass
- Rock salt
- Herbs